Hi, I’m James. Thanks for checking out Building Momentum: a newsletter to help startup founders and marketers accelerate SaaS growth through product marketing.
SPONSORED
Let your future customers come to you with Plezi One
? Looking to acquire new users for your SaaS? Create forms and magnets to generate leads, then engage them through automation and email campaigns with Plezi One. Plezi One is a web marketing toolkit that helps you focus more on your product, and less on acquisition!
There’s nothing like having something to back up your perspective – especially if it’s something controversial.
But too often, positioning narratives and content campaigns rely on blasé adlibbed theoretical statements, rather than anything concrete. We hope that we have a narrative someone can believe in – but it’s unlikely that we have evidence that someone will accept.
Creating your own statistics and gathering your own insights is a great, simple way to build persuasive evidence. Not only does it back up your positioning and narrative, but it can support coordinated activity across the business to get the biggest bang for your buck.
Gathering primary research and insight to form the basis of marketing campaigns was taught hard at advertising school and has stuck with me ever since. In fact, it’s something that I’ve done at nearly every job in the last few years.
In this post:
Examples
Here’s three examples of stat-based campaigns I’ve run that have helped drive sales, start conversations, and support go-to-market campaigns.
Kayako: Live Chat Statistics
One of our first post-launch campaigns for a new product that merged a live chat tool with a ‘home screen’ of information, this Live Chat Statistics report surveyed both businesses and consumers with their thoughts on live chat support experiences.
We aimed to show that customers wanted live chat experiences that worked, and that businesses were massively behind customer expectations.
How we used it
- We created a snazzy animated experience (see here on the Internet Archive) that delightfully illustrated the story
- We built all of the stats into our content marketing, repurposing the stats with a whole series of blog posts that looked into every angle
- We summarised into three different lead magnet PDFs that we promoted through social, email, and PPC
- We hosted webinars, guestposted, guest presented and really banged the drum of these stats over and over again
Headstart: Diversity & The Dream
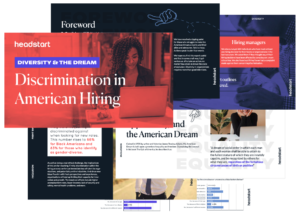
At Headstart (enterprise recruiting software for graduate hiring teams), we were looking to enter the US market with a bang. We needed to have a different take and stand out from alternative solutions by hitting prospects hard with proof.
Again, we spoke to both consumers and businesses on their experiences with discrimination, hiring, and diversity – and found some huge gaps that created a really enticing story, and proved what we already knew. You can read some of the highlights here.
How we used it
- For this traditional report targeted to enterprise champions, we leaned heavily on sales engagement to distribute. Sales reps had snippets, summary images to entice in initial emails, and personal links to see who was reading what (and when)
- We also promoted via paid LinkedIn ads to people in HR and recruiting at target organizations
- This formed the basis of a live-streamed panel conversation to extend the conversation
SmartFocus: Christmas 2014
Wow – this is 8 years ago!
At SmartFocus (previously Emailvision, which was of the original email marketing SaaS companies) we decided to double-down on the ecommerce industry.
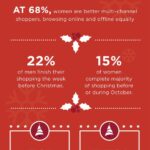
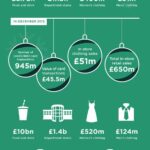
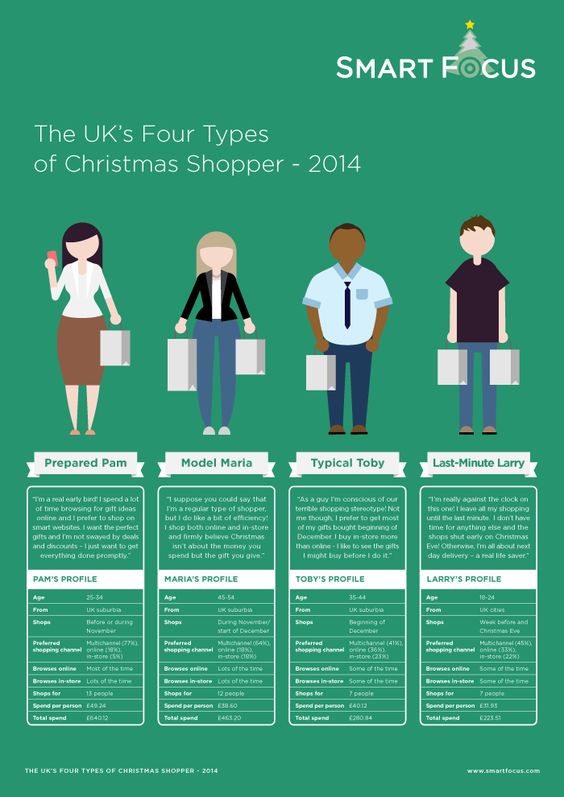
We surveyed 800+ consumers in the UK and US to understand how they’d be approaching the holiday season, creating infographics that covered market spend, the various Christmas shopper personas, and the differences between how men and women shopped for gifts.
How we used it
- This started out as just a content marketing project but quickly became a project targeted on PR outcomes – it drove mentions in many online ecommerce publications, as well as making some UK and US media mentions
- We involved our customer success team to help guide our customers with targeted recommendations
- Content, email, and social marketing campaigns as standard
Bonus: Lune
Alicia (who I run WTF is Go-To-Market? with) carried out primary research at Lune to understand consumer demand for green, climate-friendly payment methods and services. This now takes centre stage in their pitch to payment platforms.
How to create consumer research surveys
I’ll be honest: this will not be a completely scientific way to get accurate, reliable data to form the basis of strategy or make huge life-changing decisions on.
But this can help you pop above the parapet with a point of view, and provide some proof that helps push prospects along your sales and marketing process.
Define your audience
Usually, you’ll want to get weighted data that represents the census of a particular country. Platforms like Pollfish – my preferred platform of choice – does this automatically.
You’ll just need to decide the demographics of your target audience (things like location, age, gender, income, and some other markers), plus set some screening questions
Screening questions allow you to accept only respondents who meet your criteria, rejecting those from a population you’re not interested in. Tip: form your screening questions with multiple options, rather than asking for pure yes/no examples to avoid people just picking the answer they think you want.
Set your questions
If using Pollfish, you have about 18 questions to extract the juiciest information possible from your target audience before the cost goes up.
I’d recommend separating your questions into themes. For example, you might structure your survey like this:
- Problem awareness
- Problem impact
- Problem solution consideration
- Solution outcomes
Think about the angles you’re trying to extract. What’s going to surprise your audience the most? If you’re using the survey for content and sales, it needs to be have an interesting angle that suggests something your prospects don’t know. If you’re using it mostly for mainstream PR, you’ll need to have something really juicy to provide comment on pop culture.
You may want to work with a special survey writer or researcher (you can find them on Fiverr and Upwork) to make sure your questions aren’t leading, and are actually designed with best intentions in mind.
Run a pilot
Don’t pay for a huge survey to 1000 consumers without doing a smaller test first. You can pilot it either with colleagues and friends, or to a small group of 50-100 consumers.
Pilot surveys help you test whether the questions are easy to understand, if answer options make sense in the real world, and ultimately whether the survey is generating the results you want.
Ensure reliability and trustworthiness
I’m not going to trust a survey of just 200 consumers. The closer you can get to 1000 consumer responses, the more reliable (i.e. repeatable) your survey will be, and the more trustworthy your target audience will find it.
Of course, balance this with cost. If you’re investing a lot of money into the distribution of the content, it’s worth spending on the extra surveys to avoid any reliability issues.
Tip: some platforms like SurveyMonkey Audience will charge you based on the distribution of the survey to a number of potential respondents, not completed surveys. Pollfish charges only on the number of fully-completed surveys you get back.
Crunch that data
Now it’s time to slice and dice that data until you carve perfect nuggets of statistical goodness.
If you’re using Pollfish, the platform already provides a tool to help you segment the data by demographic insights and answers to other questions. This is where you can analyse to find the deltas and gaps and correlations to provide great stats for your report.
Consider all the angles
Often surveys become a bit repetitive… 50% do this… 34% think that… A third of people read this... Try to avoid this.
Group 1 are more likely to X than Group 2. Group 3 do this X times, but this increases to Y times when they are Z.
You can also change how you present the stats. 50%…, Half of…, The majority of… all help you keep readers engaged – and help you tell a story.
You can also think about collecting qualitative data, which is great for human interest angles. These can make strong emotional connections and really embed your survey results in real life.
Design your report
Creating a PDF report or standalone web page is a great way to showcase your survey report in an engaging way. Don’t limit yourself to A4 pages – think about a long, flowing report that readers will peruse on their phone or at their computer.
You can get creative with graph design, showing stats as bar charts or pie charts or line graphs or whatever makes sense.
Unethically, this is your opportunity to convince readers that your stats tell the whole story. You can write the report like you would a story: presenting challenges, introducing the hero, selling the dream outcome, the roadblocks to get there, etc.
Repurpose, repurpose, repurpose
If you’ve invested so much time and effort and money in your survey, don’t let it flop. These stats can become a core part of your positioning and sales narrative, and provide months and months of juice for your content team.
- Tie in your report with events: hold online webinars or IRL conference talks to introduce your stats and hold space for discussion
- Introduce to your customers just as much as your prospects: they can be a big vehicle for distribution
- Think social by default: shareable images and videos
- Train your teams: build the survey results into your sales process at both the top and bottom of the funnel, generating interest and reiterating its importance throughout
- Arm your teams: make sure your sales, marketing, and customer success teams have the material, content, and collateral they need to use the outcomes you’ve discovered in their everyday work
- If the focus is PR, bring a PR team in early: they’ll be able to help guide and shape the survey with journalists to maximise hit rates
- Distribute: guest-post on partner sites, join partner webinars, add your stats to ‘top stats’ for inclusion and backlinks, syndicate content with publishers
- Repeat and repeat and repeat: repeat the outcomes you’ve discovered until everyone inside and outside your business knows them by heart
Your outcomes are only as good as your preparation
If you write a question that’s a bit too confusing, or set up a screening question incorrectly, your data is going to be skewed – and that’s not good.
Putting extra emphasis on preparing your survey pays dividends. If you can, work with a researcher who can craft the survey, manage responses, and analyse the data to give you the best outcomes.
You also need to understand how you will use the survey before you carry it out. Exploratory quantitative research helps nobody. Validate themes and understand likely directions through qualitative research first before going out to build your survey. Know exactly how you’ll repurpose the content to support different marketing and sales activities to avoid wasting time.
Lastly: don’t overdo these kind of campaigns – and when you do, do it well.. It’s become standard for ‘digital PR’ agencies to create crappy, linkbait surveys that are only tangentially connected to the business, that are weak and implausible – damaging brand perception.
Good luck! I’d love to see the surveys you’ve run – drop me a note or leave a comment!
Thanks for reading! Let me know what you thought – find me on Twitter and LinkedIn.
P.S. If you’ve found value in Building Momentum, could you buy me a coffee? Here’s my tip jar – any support is gratefully appreciated!
P.P.S: If you enjoyed this post, will you share Building Momentum with your network?


